Introduction to Survey Data Analysis: How to Use Simple Tabulation and Cross-Tabulation
2024/10/08

We can derive insights that inform real-world actions and strategies by tabulating and interpreting data collected online or in paper surveys.
This article explains the basics of two essential tabulation methods: "simple tabulation" and "cross-tabulation," highlighting the differences in the data types obtained through each approach.
What is Simple tabulation?
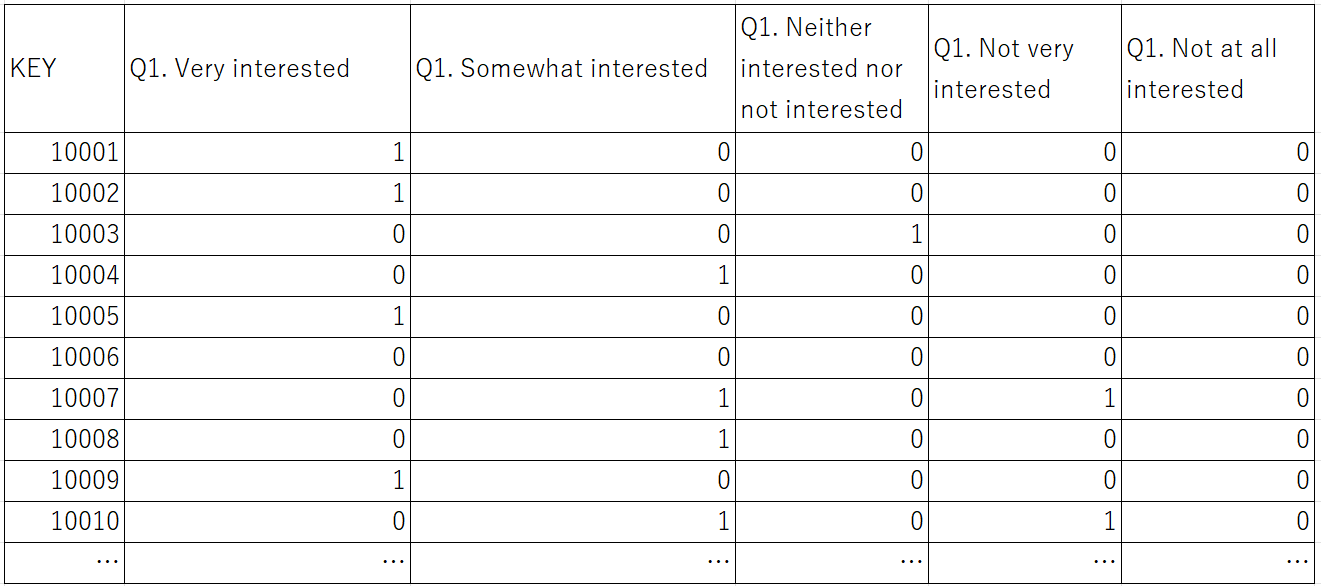
Survey results first appear in the form of what we call raw data.
Raw data simply lists data from each respondent, making it challenging to analyze or utilize the survey results effectively.
・Example of Raw Data
It is necessary to analyze the survey results to obtain usable data, starting with "tabulation."
The most basic tabulation method is "simple tabulation (GT, grand total)."
Simple tabulation involves tabulating each question individually. This method provides:
○ Number of respondents who answered the question (frequency, n-value)
○ Percentage of respondents who answered the question (% or ratio)
○ Average value
Simple tabulation is suitable for grasping general trends, as it allows for listing the actual number or percentage of respondents who chose a particular option.
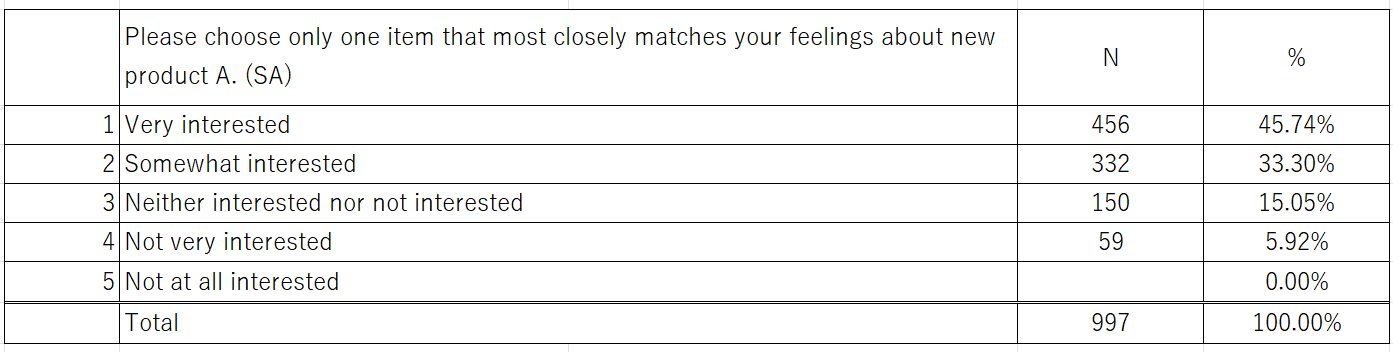
Analyzing the simple tabulation table above, we can see that 79% of respondents indicated they are "very interested" or "somewhat interested" in the new product A, suggesting a high overall level of anticipation for this product.
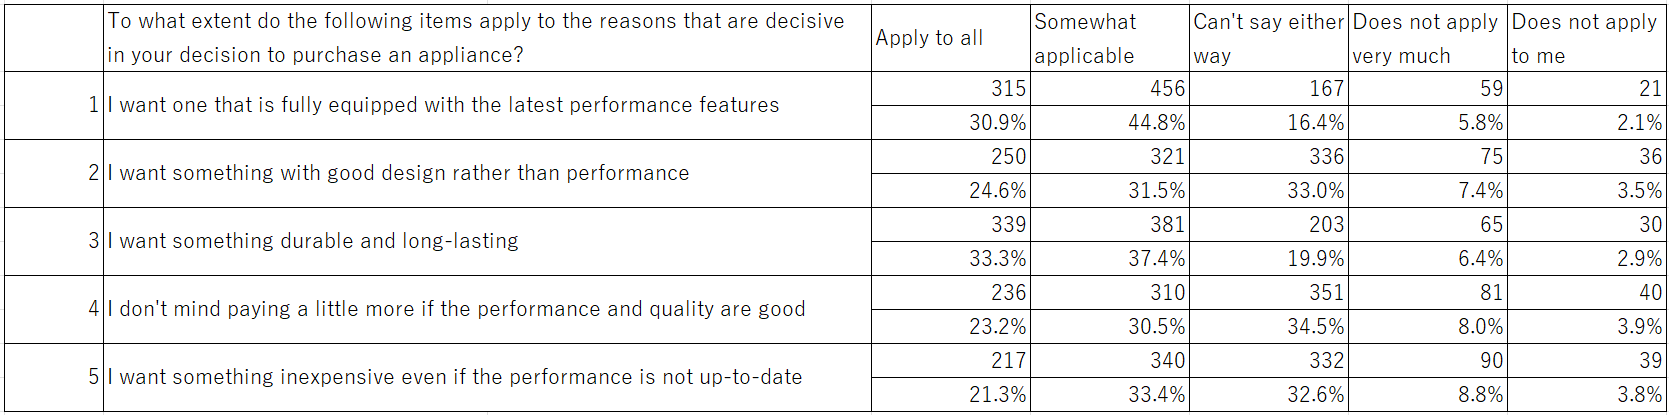
Simple tabulation tables also include matrix questions, which work well when evaluating multiple products or comparing images. They allow the same questions to be asked all at once in a tabular format.
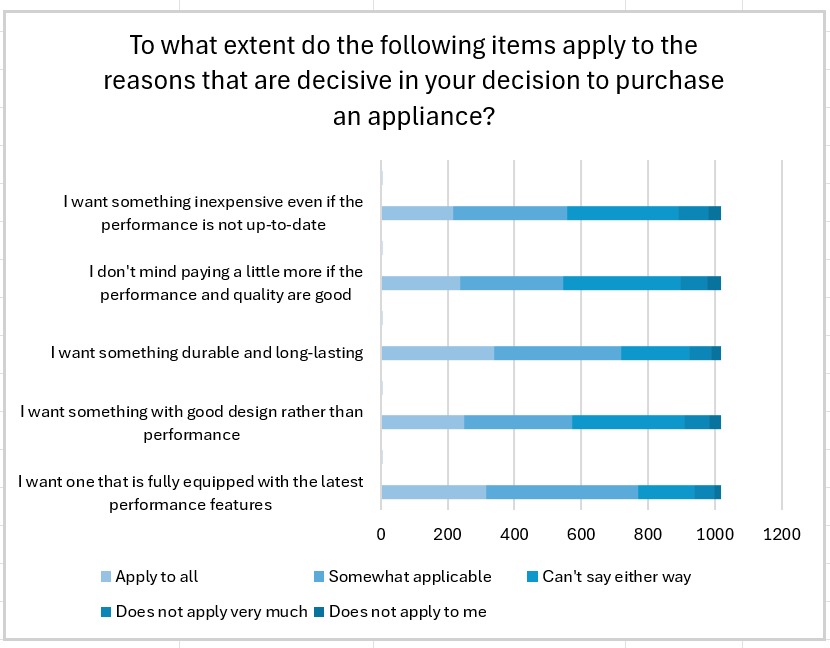
Visualizing simple tabulation in the form of a graph makes it even easier to understand at a glance, as shown below:
What is Cross-Tabulation?
Cross-tabulation is a tabulation method that combines two or more simple tabulations. It can be created using pivot tables in spreadsheet software like Excel.
While simple tabulation provides an overall view of the total number of responses, cross-tabulation allows you to break down the responses into groups such as "by gender," "by age group," or "by type of response."
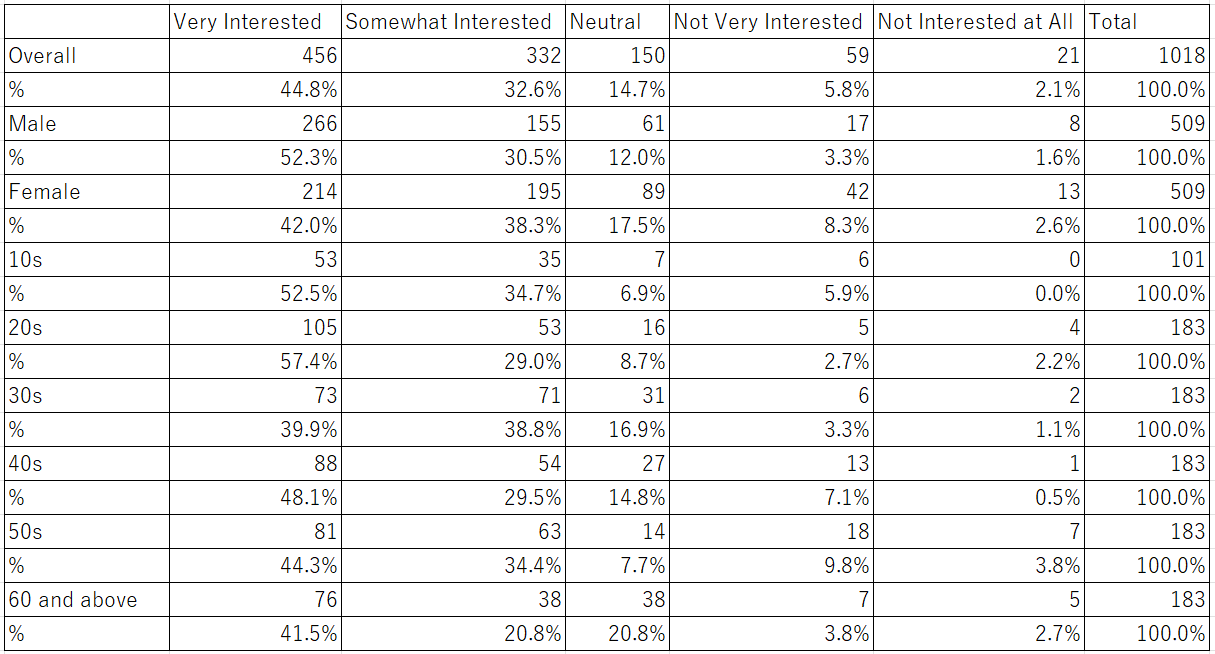
In the simple tabulation previously shown, we could only grasp that many people were interested. However, looking at the cross-tabulation table, we can see, for example, that there is not much difference in interest between genders. When analyzed by age group, it shows that people in their 20s have the most interest, although there is also noticeable interest from those in their 30s and older.
The following are the two main methods for cross-tabulation:
- Attribute Cross-Tabulation
Attribute Cross-Tabulation helps to analyze trends based on the attributes of respondents (such as age, gender, place of residence, occupation, marital status, and family composition) from data collected through surveys. Respondent attributes may also involve combinations of different elements, such as age and gender.
- Inter-Question Cross-Tabulation
This method involves cross-tabulation between different survey questions rather than focusing on the attributes of respondents. Combining multiple questions helps to understand the interrelationships between different survey questions beyond respondent attributes.
When to Use Simple Tabulation and Cross-Tabulation
So, how would you know when to use simple tabulation or cross-tabulation?
Simple tabulation is suitable for a general overview of overall evaluations or trends. The recommended approach is to start with simple tabulation to understand the overall picture and then, based on hypotheses, use cross-tabulation to analyze the breakdowns by respondent attributes or individual questions.
At GMO Research & AI, we offer survey services tailored to meet your specific needs. For example, our customizable Custom Survey enables detailed research based on particular requirements. When using the Custom Survey, you will receive raw data along with a simple tabulation table (GT table). Options for cross-tabulation and reports are also available. Please feel free to contact us for more information.
Beginner's Guide to Successful Online Survey
 |
Using online surveys is a quick and cost-effective way to understand your target consumer and build right strategies. |
