Getting Started with AI Survey Data Analysis: A Beginner's Guide with Practical Prompts
2024/12/05

Getting Started with AI Survey Data Analysis: A Beginner's Guide with Practical Prompts
Though online surveys are a valuable way to gather insights efficiently, survey data analysis—one of the most complex parts of research—can be daunting for businesses lacking extensive technical skills and resources. However, with recent advances in AI, specifically large language models (LLMs) like ChatGPT, Gemini, and Claude, data interpretation has become more accessible, even without a high level of expertise. The need to outsource entire research projects to professional firms becomes less significant and ultimately lowers research costs.
This article guides you through leveraging ChatGPT for effective survey data analysis, offering practical prompt examples and a straightforward workflow to transform raw data into actionable insights.
ChatGPT Prompt Input Guide for Survey Data Analysis
This section demonstrates a basic workflow for survey data analysis with ChatGPT. ChatGPT 4o is the model used in the examples throughout this article.
1. Upload Raw Data
Start by uploading your survey data in a structured format like CSV. Direct import from Google Drive and Microsoft OneDrive is also supported.
2. Prompt Input
Here is a step-by-step guide to create a prompt that ensures that ChatGPT understands your needs.
Step 1: Describe your role or create a persona and clarify the mission
Step 2: Briefly explain what the uploaded data is about
Step 3: State the Purpose and Analysis Goal
Step 4: Request an Output Format
Summary of the data (100 words)
Quantitative data analysis describing the main trends (200 words)
Cross-tabulation
Segmentation Analysis
5 recommended strategies for business (50 words for each strategy)
Try including extra instructions for a response aligning to your exclusive needs. For example, the goals of your business, target audience of the analysis report, detailed request for generating tables and graphs.
3. Double-check the Output and Adjust
ChatGPT quickly generates the analysis report based on the imputed prompt. Since there is a possibility of false data being generated, as is sometimes the case with AI, make sure to apply human checks to avoid inaccurate information.
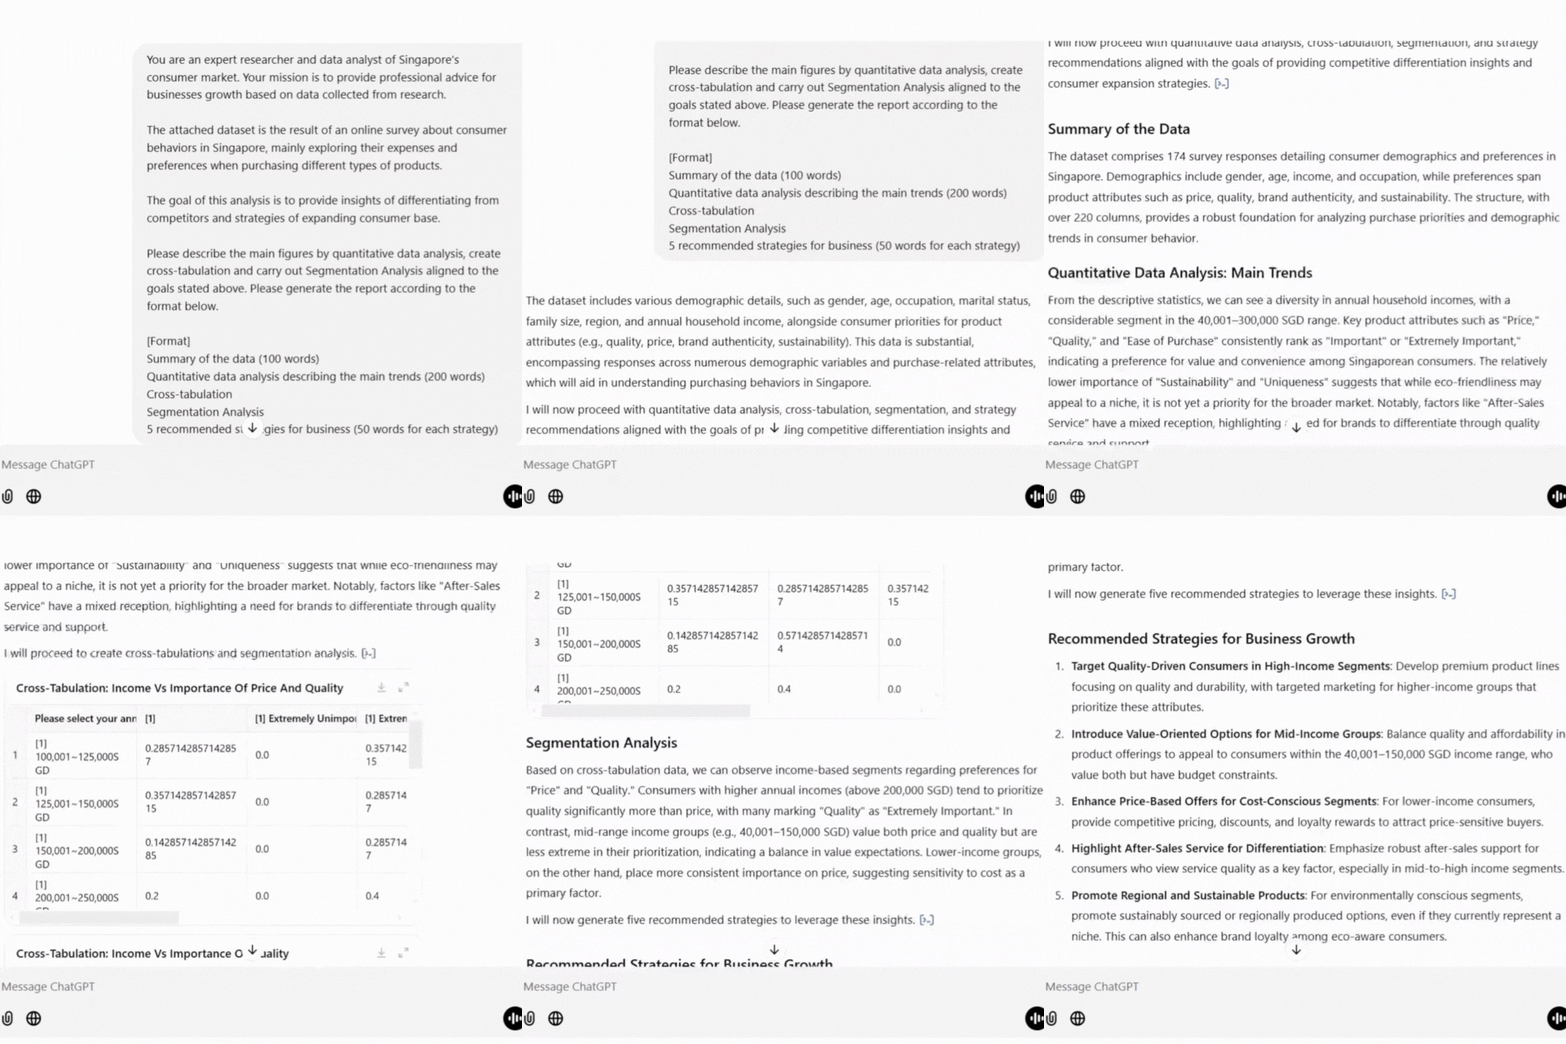
If you desire more comprehensive insights for actionable plans, ask ChatGPT extra questions for deeper analysis on specific factors. The next section provides more examples of analysis available on ChatGPT with sample prompts.
More Examples of Data Analysis using ChatGPT
1. Descriptive Statistics
ChatGPT calculates basic statistics quickly like response frequencies and percentages, giving an overview of how participants responded to each question.
● Frequency Counts: calculate the number of responses for each answer option (e.g., how many respondents selected “Very Satisfied”).
● Percentages: providing the percentage distribution for each response (e.g., 45% chose “Satisfied”).
● Mean, Median, Mode: calculate questions with numerical scales, such as rating questions to provide insights into the central tendency.
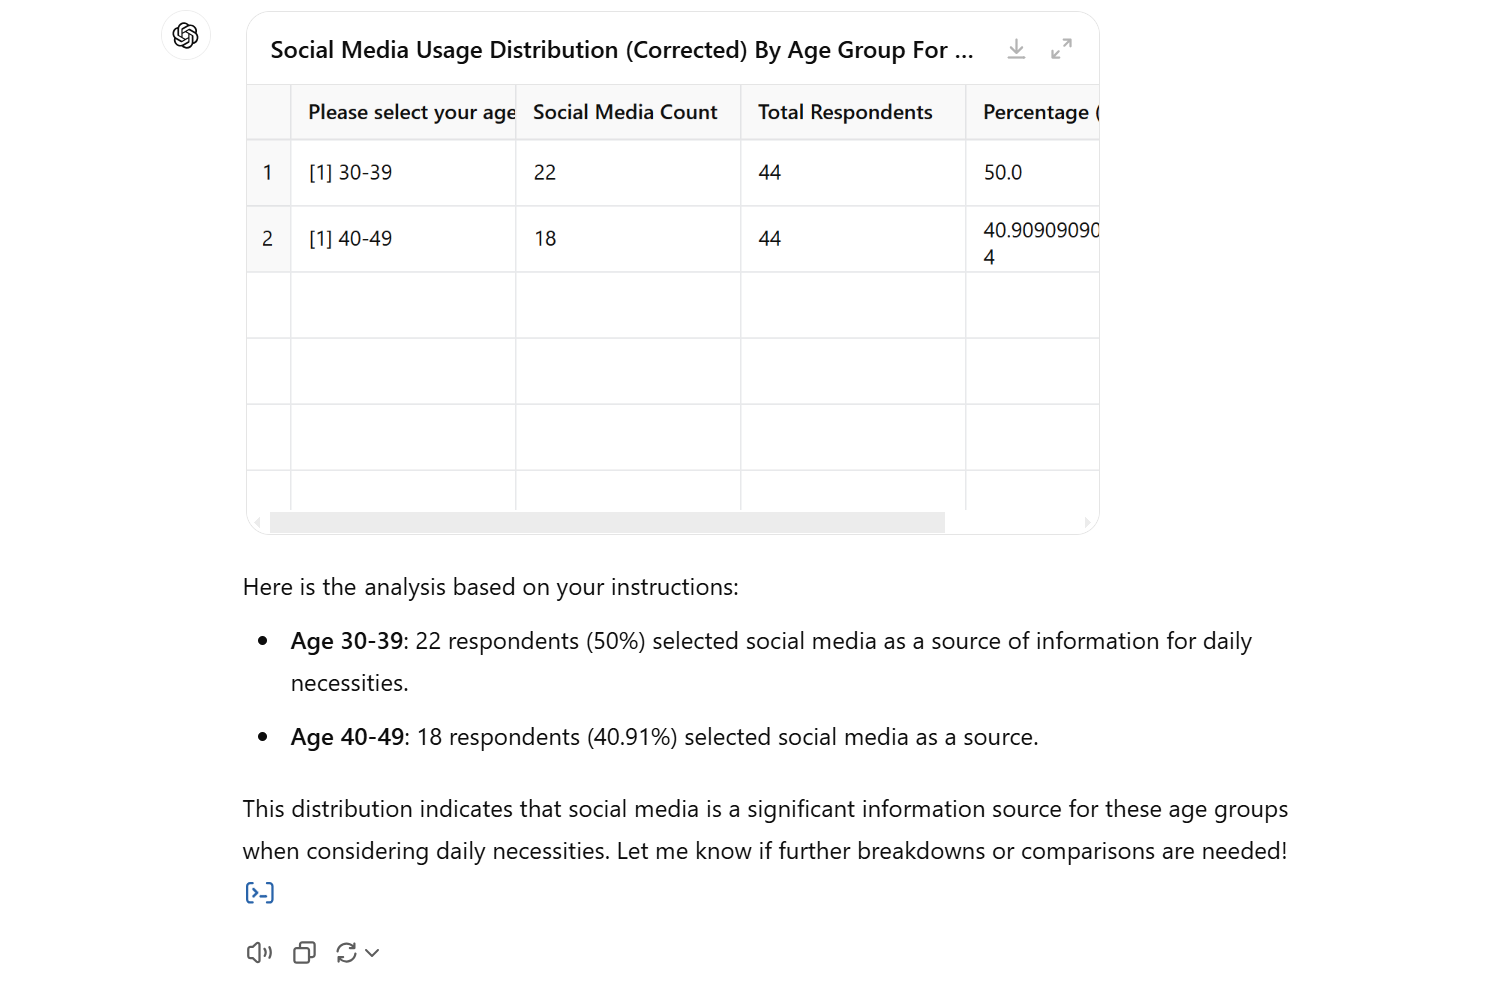
ChatGPT created a table and description showing the distribution of data with just a prompt. The table is also downloadable as a CSV file.
2. Cross-Tabulation
This allows users to see relationships between two variables (e.g., age group vs. satisfaction level).This is effective in highlighting key trends and helping teams understand differences among respondent groups.
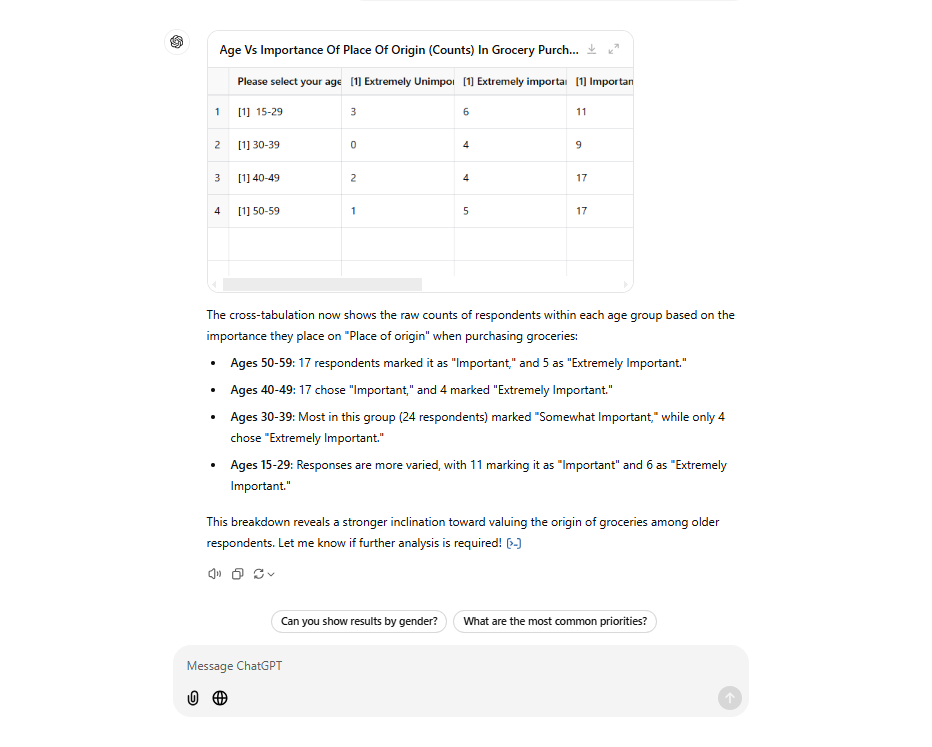
By specifying the variables that you'd like to cross-tabulate, ChatGPT will display a table comparing each combination.
Introduction to Survey Data Analysis: How to Use Simple Tabulation and Cross-Tabulation
3. Segmentation Analysis
ChatGPT can categorize responses based on demographic or behavioral factors, such as age, location, or purchase preference. This segmentation helps identify specific customer needs and behaviors, guiding more tailored strategies.
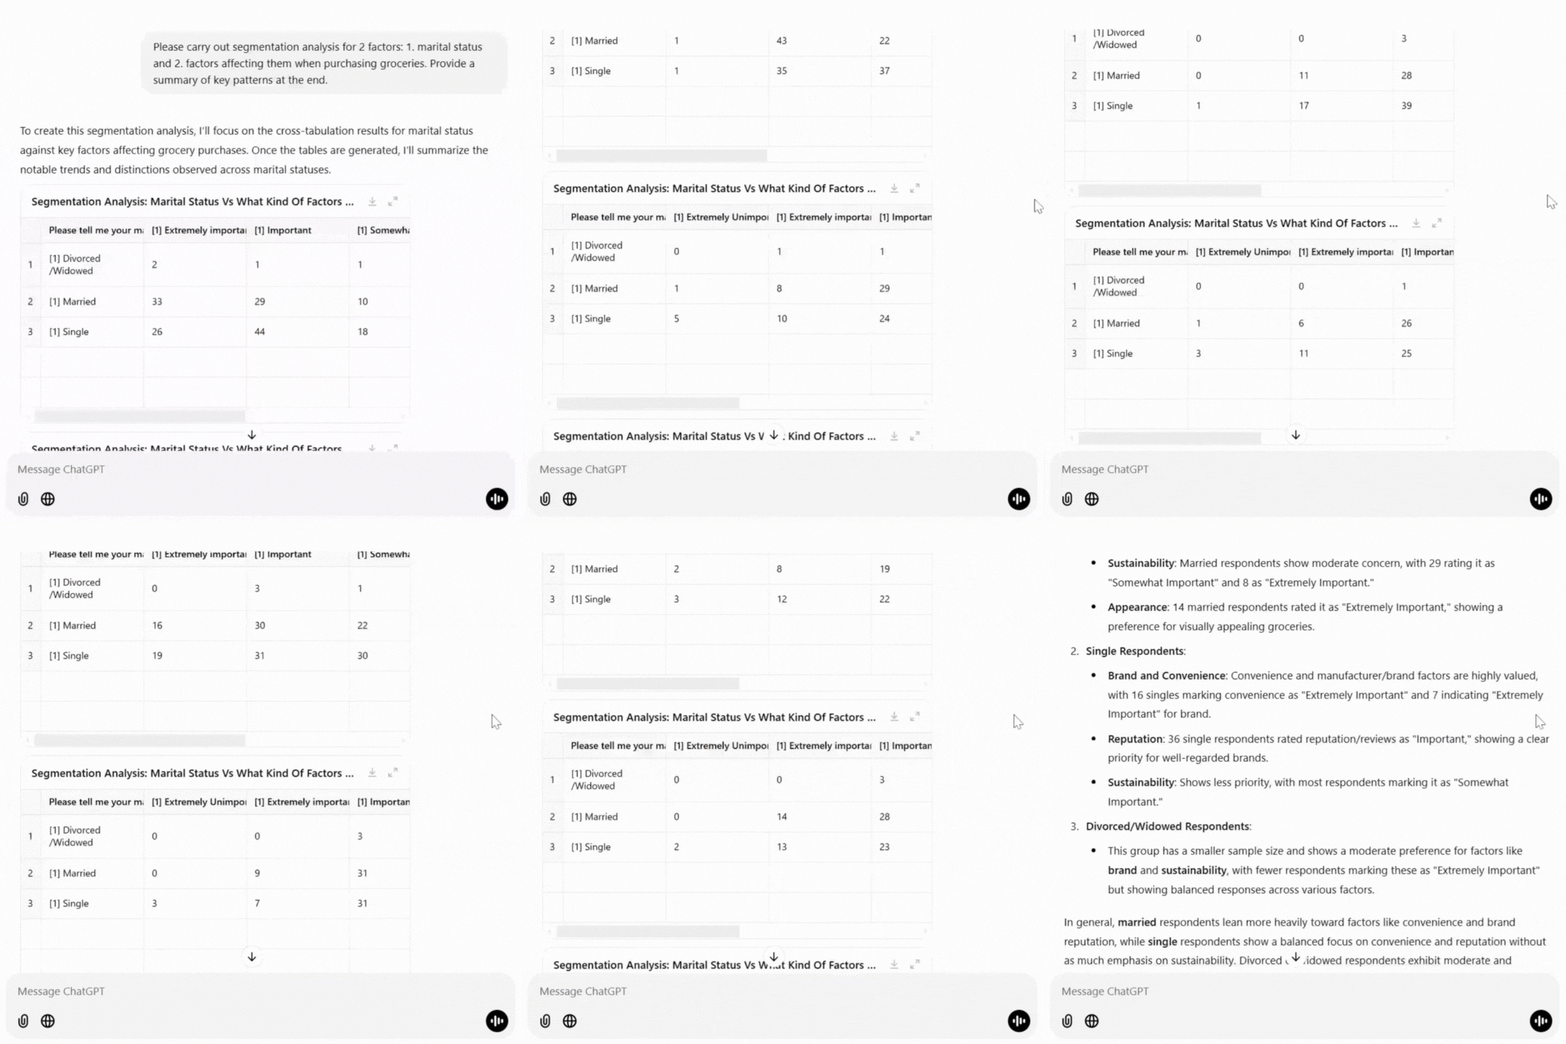
After specifying the factors for segmentation analysis, ChatGPT created tables from related data columns and provided key patterns of each segment, which provided hints for overall understanding of the market and business strategies.
4. Correlation Analysis
ChatGPT detects correlations between variables —such as the relationship between frequency of use and satisfaction level. This can reveal impactful patterns, informing future business decisions.
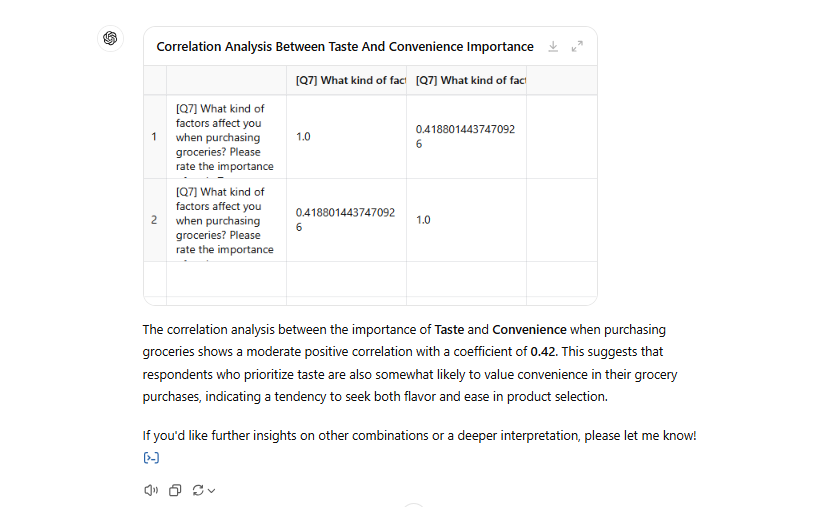
It is also possible to visualize the analysis results by requesting a graph.
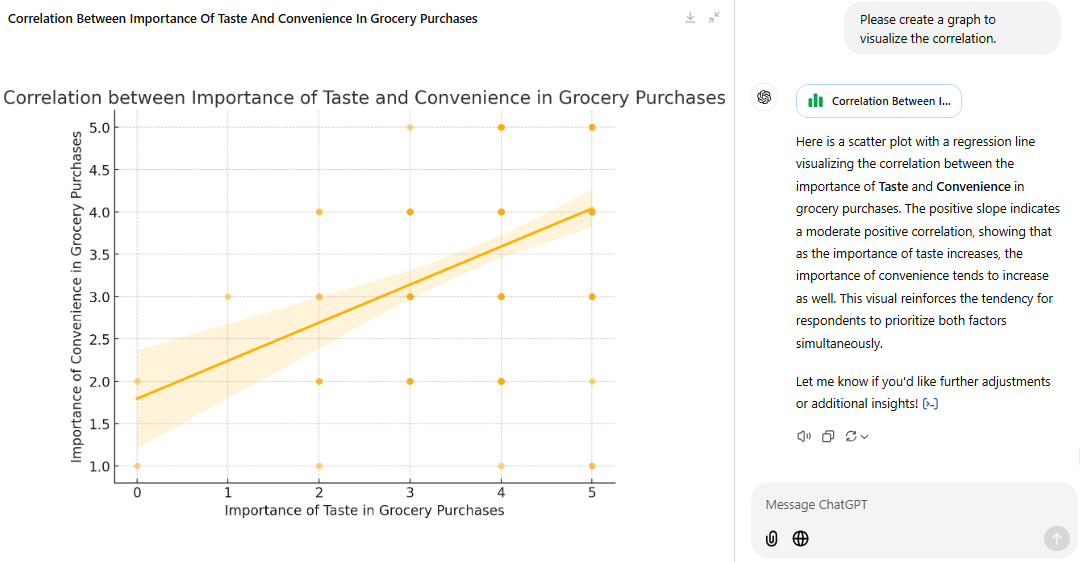
*Remarks: Some of the prompts are skipped for the purpose of presentation and to facilitate understanding. Keep communicating with ChatGPT for your ideal output of data!
Extra Tips for Survey Data Analysis with AI
Interpreting Results with Caution
While AI is capable of highlighting trends and correlations, it’s essential to interpret these findings carefully. Correlation does not always imply causation, and AI-generated insights should be validated with contextual knowledge and business expertise to avoid misinterpretations.
Data Preparation
Ensure your data is well-organized and clean. Removing inconsistencies and formatting data properly improves the quality of AI-generated insights.
Handling Confidential Information
Be cautious about sharing sensitive or confidential data with AI tools. Anonymize or generalize identifiable information in your data to maintain privacy and comply with data protection standards.
Start your Discovery with Quick Survey
With these simple prompting techniques for ChatGPT, data interpretation becomes more accessible for all, enabling businesses to make data-driven decisions quickly from survey data.
Ready to gather data for insights discovery? Quick Survey by GMO Research & AI offers a fast, affordable, and easy-to-use service that empowers you to gather real-time feedback from your target audience across 16 APAC regions. Explore more at the link below!

Beginner's Guide to Successful Online Survey
 |
Using online surveys is a quick and cost-effective way to understand your target consumer and build right strategies. |


