Why Japanese Respondents Drop Out — And What It Means for Your Online Survey Design
2026/06/12
Table of Contents
Introduction
Japan is one of the most survey-active markets in Asia — yet getting Japanese respondents to complete a study requires more than just sending an invitation. Survey design choices that work well in other markets can quietly undermine participation in Japan, and the reasons are rarely obvious from response data alone.
To understand what’s really happening, GMO Research & AI asked the respondents themselves. We surveyed 604 active Japanese online panelists about their survey-taking behaviors, what makes them hesitate, and what keeps them genuinely motivated to participate. The findings point to four consistent design traps — and what actually drives engagement.
Key Takeaways
- 55.3% of those who dropped out cited the survey being too long
- 74.5% can only concentrate for 10 minutes or less
- 46.7% cited ease of answering as a top participation factor
- 53.8% said making good use of free time motivates them beyond rewards
|
For online research in Asia, learn how GMO Research & AI's online panel supports your needs. |
Respondent Profile
This survey targeted 604 active Japanese online panelists from GMO Research & AI’s Online Panel in Japan — 49.8% male and 50.2% female. Generationally, respondents were split across Gen Z (28.0%), Millennials (34.6%), and Gen X (37.4%).
The sample was designed to capture experienced, frequent survey-takers: 92.4% have completed 50 or more surveys, and 87.6% participate almost every day.
What Japanese Survey Respondents Say Matters Most
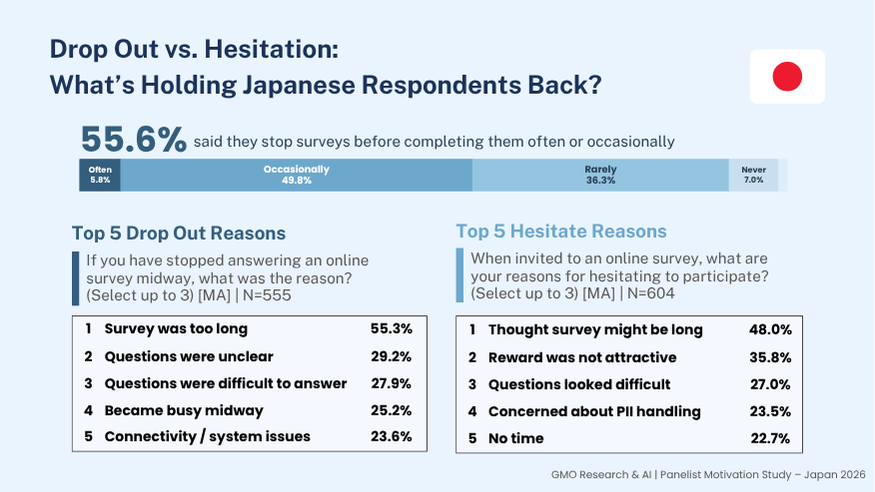
Understanding what shapes participation decisions in Japan starts with what respondents say directly. In this survey, 55.6% said they had stopped a survey before finishing it often or occasionally — with the most common reason being that it simply ran too long (55.3% of those who dropped out). Hesitation before starting follows a similar pattern: 48.0% held back because they expected the survey to be long, and 27.0% because the questions looked difficult. Importantly, both drop-off and hesitation point largely to survey design factors that researchers can address.
*Click on the image to expand
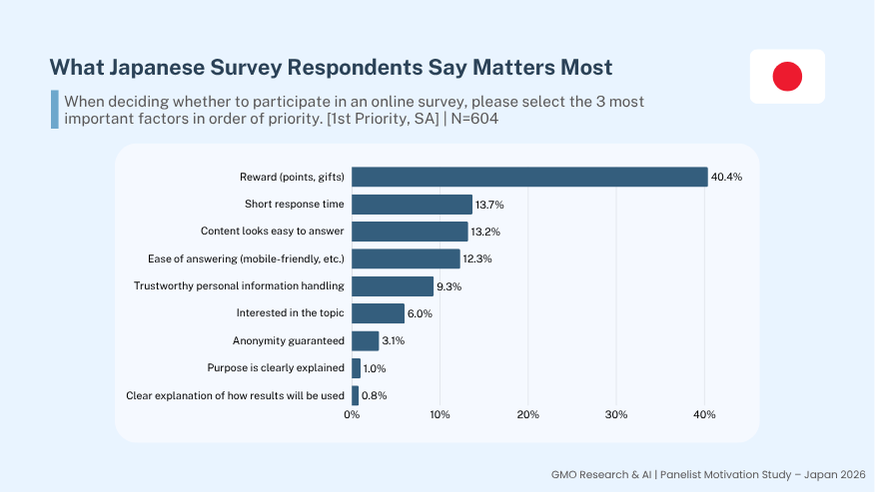
When asked to identify their single most important participation factor, 40.4% ranked reward first — followed by short response time (13.7%) and content that looks easy to answer (13.2%), indicating that brevity and accessibility matter alongside the incentive itself. Beyond rewards, 53.8% cited making good use of free time as a reason to participate, followed by being able to answer topics they find personally interesting (37.3%).
Each of these barriers and motivators maps directly to one of the design factors below.
Part 1: Survey Design Traps That Drive Japanese Respondents Away
Trap 1: Survey Length — It’s About Respecting Respondents’ Time
Survey length is the single biggest driver of drop-off in Japan — and the problem runs deeper than asking too many questions.
When asked how long they can concentrate while answering a survey, 74.5% said 10 minutes or less: 16.1% lose focus within 3 minutes, 32.5% after about 5 minutes, and 26.0% between 5 and 10 minutes. Gen X respondents showed the shortest windows (77.9%), compared to 65.2% of Gen Z. Among those who have dropped out, 55.3% said the survey was too long — the top reason by a clear margin — and 48.0% held back from starting a survey for the same reason.
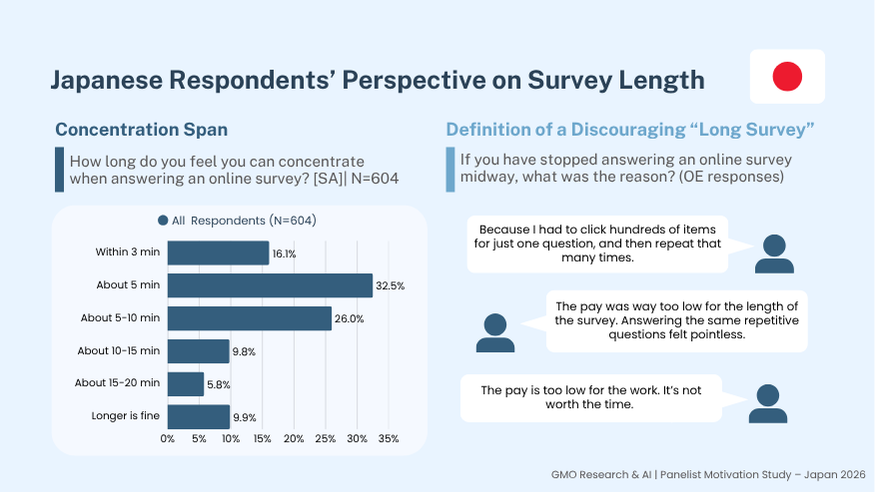
But “long” means more than duration. Open-ended responses reveal three recurring frustrations: reward not proportionate to effort (“the survey length and the reward didn’t match”), repetitive questioning (“the same content kept repeating — it felt meaningless”), and no sense of an end (“too many questions and options — I couldn’t see where it was going”). Reducing drop-off requires eliminating redundancy and giving respondents a visible sense of progress, not just cutting total question count.
Trap 2: Question Burden — Clarity and Cognitive Load
Even at the right length, poorly constructed questions carry their own drop-off risk. Among those who dropped out midway, 29.2% cited unclear questions and 27.9% cited questions that were difficult to answer. The barrier shows up before answering begins too: 27.0% hesitated because the questions looked difficult, rising to 33.6% among Gen X.
Subject matter amplifies this. Automobiles and transportation and finance and insurance saw the lowest engagement, with over 50% of respondents saying they are not interested in either — categories that also tend to require familiarity with technical terminology. When the topic itself demands prior knowledge, question design needs to work harder to compensate.
Localization is a related factor worth noting. Surveys translated directly from English without adapting phrasing or response options for a Japanese context can introduce ambiguity that adds to cognitive load — and increases the likelihood of abandonment.
Trap 3: Privacy Concerns — A Quiet but Persistent Barrier
Privacy sensitivity is not the leading drop-off factor, but it surfaces consistently across both participation and completion stages. Among respondents who stopped a survey midway, 22.0% felt uncomfortable being asked for personal information and 13.7% were asked for information they didn’t want to share. At the invitation stage, 23.5% hesitated due to concerns about personal information handling. Women were notably more affected, with 28.7% citing this hesitation compared to 18.3% of men.
The practical fix is transparency: explaining upfront what information will be collected, why it’s needed, and how it will be used can meaningfully reduce hesitation and mid-survey drop-off.
Trap 4: UX and Usability — When the Experience Gets in the Way
Design quality and technical performance are easy to overlook in survey planning — but they register clearly with respondents. Among those who dropped out, 21.8% cited a response page that was hard to use, and 23.6% pointed to connectivity or system issues as the reason they stopped. On the participation side, 12.3% ranked ease of answering — covering mobile-friendliness, interface clarity, and overall usability — as their single most important factor, placing it among the top four drivers alongside reward, short response time, and content that looks easy to answer.
Keeping interaction design simple and ensuring the survey renders reliably across devices can reduce a category of drop-off that is largely preventable — regardless of how well the content itself is designed.
What Keeps Japanese Respondents Engaged
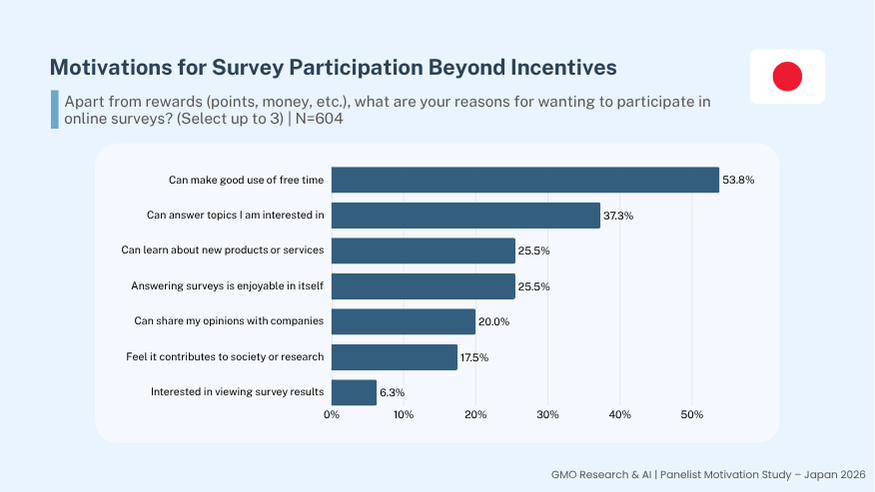
Beyond incentives, Japanese respondents cited a range of reasons that bring them back to surveys. When asked what motivates their participation aside from rewards, 53.8% cited making good use of their free time. Being able to answer topics they find personally interesting followed at 37.3%, with learning about new products or services and finding the experience enjoyable each cited by 25.5%.
For researchers, this is worth keeping in mind at the design stage. A survey that feels like a worthwhile use of time — not one that drags on or loses focus — is more likely to hold attention through to completion, complementing the reward rather than undermining it.
Putting It Into Practice: A Japan Localization Checklist
Alongside the design factors covered above, a few Japan-specific localization practices can further reduce friction for respondents:
- Use polite, honorific language — tone and formality signal respect and encourage cooperation
- Select an appropriate number of scale points — Japanese respondents tend to choose moderate or neutral options to avoid expressing strong opinions. Adjusting the scale (e.g. even vs. odd number of points) based on your research objective can help capture more balanced responses
- Rephrase negative questions positively — Japanese respondents tend to avoid strong negative expressions, so framing like “areas for improvement” surfaces more candid responses than direct criticism
- Provide a “Prefer not to answer” option for sensitive topics such as income, health, or political views
- Localize currencies and units to Japanese standards (¥, kg, Celsius) to avoid unnecessary cognitive friction
For a full checklist, refer to GMO Research & AI’s Localization Checklist for Online Research in Japan.
Designing Better Online Surveys for Japan
Japanese panelists bring experience and consistency to every study they take — but they are also discerning. Length, cognitive load, privacy, and usability are the four points where surveys lose them. Addressing these isn’t about lowering the bar; it’s about designing studies that respect respondents’ time and effort from the first question to the last.
Japan is one of three markets covered in this research series. For perspectives from South Korean and Chinese respondents, see our companion articles below.
For a full picture and detailed survey results,
please feel free to download the tabulated data.
Interested in learning how to succeed with your survey projects in APAC?
Find out more from our previous contents!
Find out more from our previous contents!
Survey Specifications
Survey Date: Apr 13-24, 2026
Method: Online survey
Target Group: Panelists participated in online surveys for more than 10 times
Region: Japan
Sample Size: 604
Conducted by: GMO Research & AI
 |
Reviewed by: Yukiya Nagata
Executive Managing Director of GMO Research & AI
|
Joined GMO Research & AI in 2011, Yukiya was the domestic sales director of the Japan headquarter until 2016. He then shifted to a new role of managing the global panel and developed online research services in South-East Asia. He also launched the Malaysia office, operating the company as a managing director until 2021. As a board member, his current role involves seeking new business opportunities and partners worldwide.
